Mapping Europe’s XR ecosystem: how we built the OpenVerse Technology Radar
The OpenVerse Observatory holds several hundred records: companies working in extended reality, expert profiles, industrial case studies, national initiatives, regulatory sandboxes, EU‑funded projects. Each record is tagged against a taxonomy of 117 topics. That is a lot of well‑structured data, and almost none of it is legible as a list.
The Technology Radar exists to make it legible. It plots every taxonomy topic according to how much Observatory content sits behind it, so that in a few seconds you can see where Europe’s XR and Virtual Worlds landscape has genuine depth and where coverage is still thin.
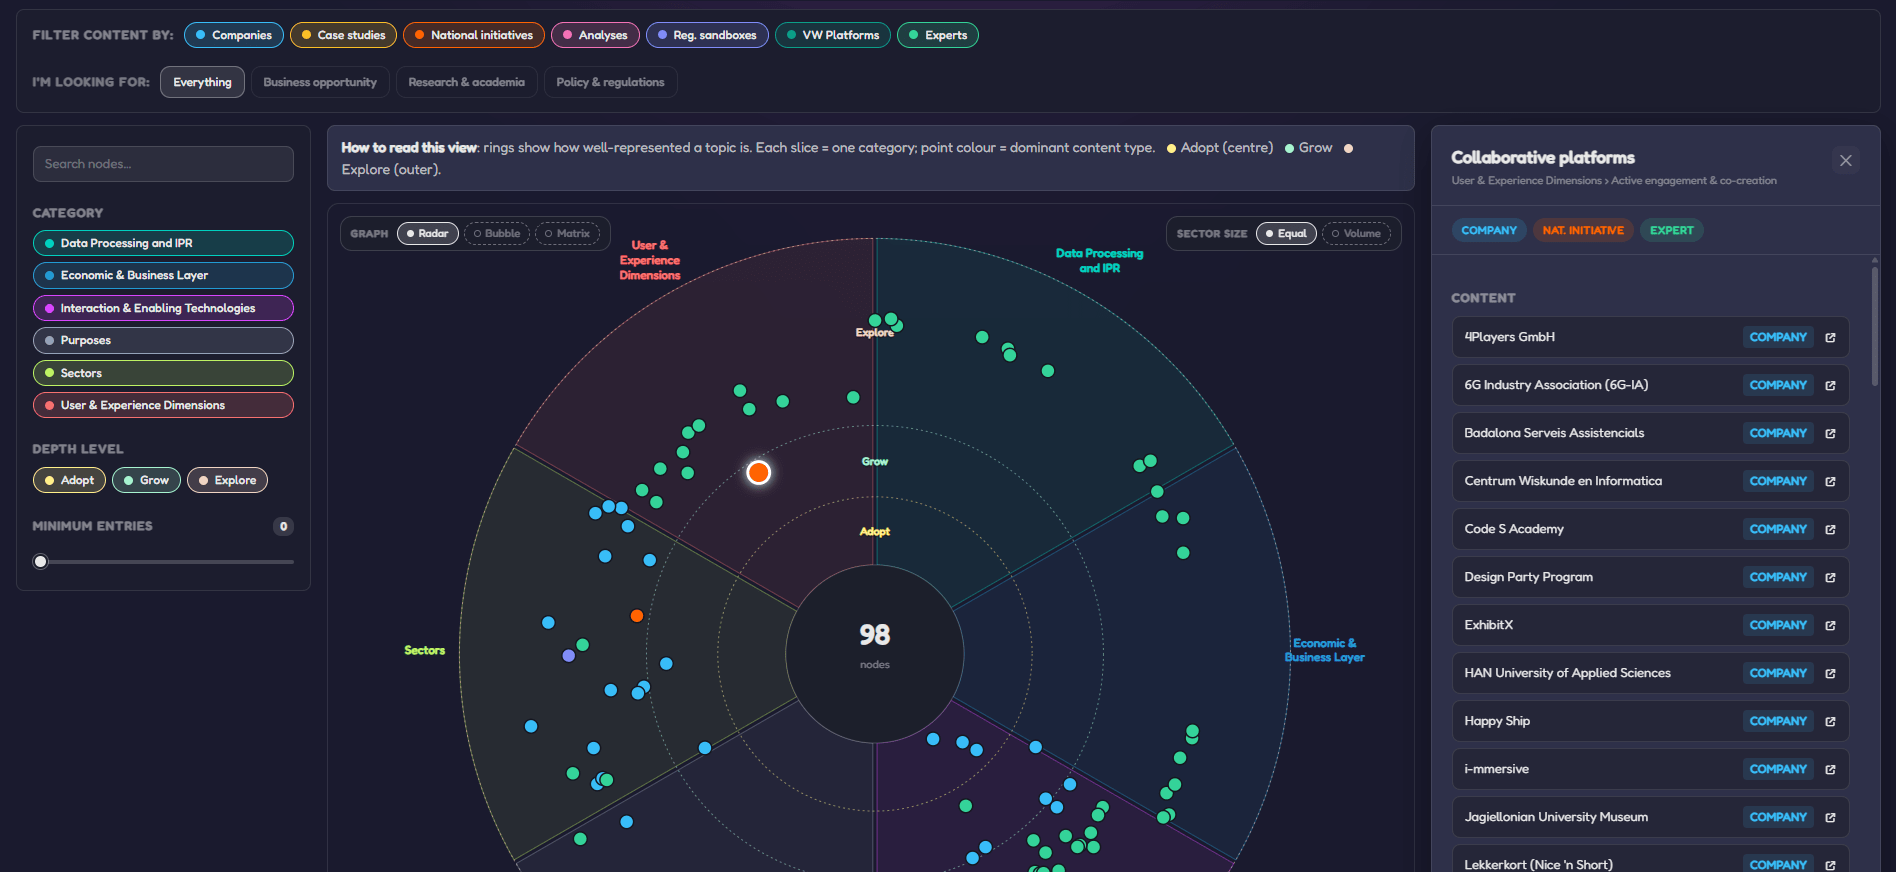 The OpenVerse Observatory Technology Radar
The project behind it
OpenVerse is a three‑year Coordination and Support Action funded by the European Union under Horizon Europe (grant agreement 101135701). It works towards open, human‑centric Virtual Worlds in Europe: transparent, inclusive, ethically and environmentally responsible, and contributing to the technological sovereignty of the EU. Its outputs include a knowledge base on the European XR and Virtual Worlds ecosystem, a community of stakeholders, technology and policy roadmaps, and a set of real‑world co‑creation pilots.
COMMpla joined the consortium as a technical partner, working alongside our parent company Trust‑IT Services, which leads the project’s Technology Watch, Taxonomy and Observatory development. We designed and built the Technology Radar.
What the Radar does
Everything in the Observatory is tagged against the OpenVerse taxonomy, which organises the XR and Virtual Worlds space into six macro‑categories: Interaction & Technologies, Sectors, Economic & Business Layer, User & Experience Dimensions, Data Processing and IPR, and Purposes.
Each topic then falls into one of three depth levels, based on how much content the Observatory holds on it. Adopt covers the topics with the strongest coverage, Grow the ones gathering momentum, Explore the emerging areas with limited material so far. The thresholds are calculated against the whole dataset, so a topic keeps its depth level whatever filters a visitor has applied.
Three views present the same data in different ways:
- Radar. Six slices, one per macro‑category, and three concentric rings for the depth levels. Each topic is a dot, coloured by the content type that dominates it. Sector width can be switched between equal slices and slices sized by the volume of content in each category.
- Bubble. Topics as circles sized by total content volume, coloured either by category or by dominant content type. A dedicated offer and demand mode splits each bubble into two proportional arcs, showing how many registered experts list a topic as expertise they offer against how many are actively looking for it.
- Matrix. A six by three grid of categories against depth levels, either as a dot layout or as a heatmap where cell brightness reflects the number of distinct entities behind that combination.
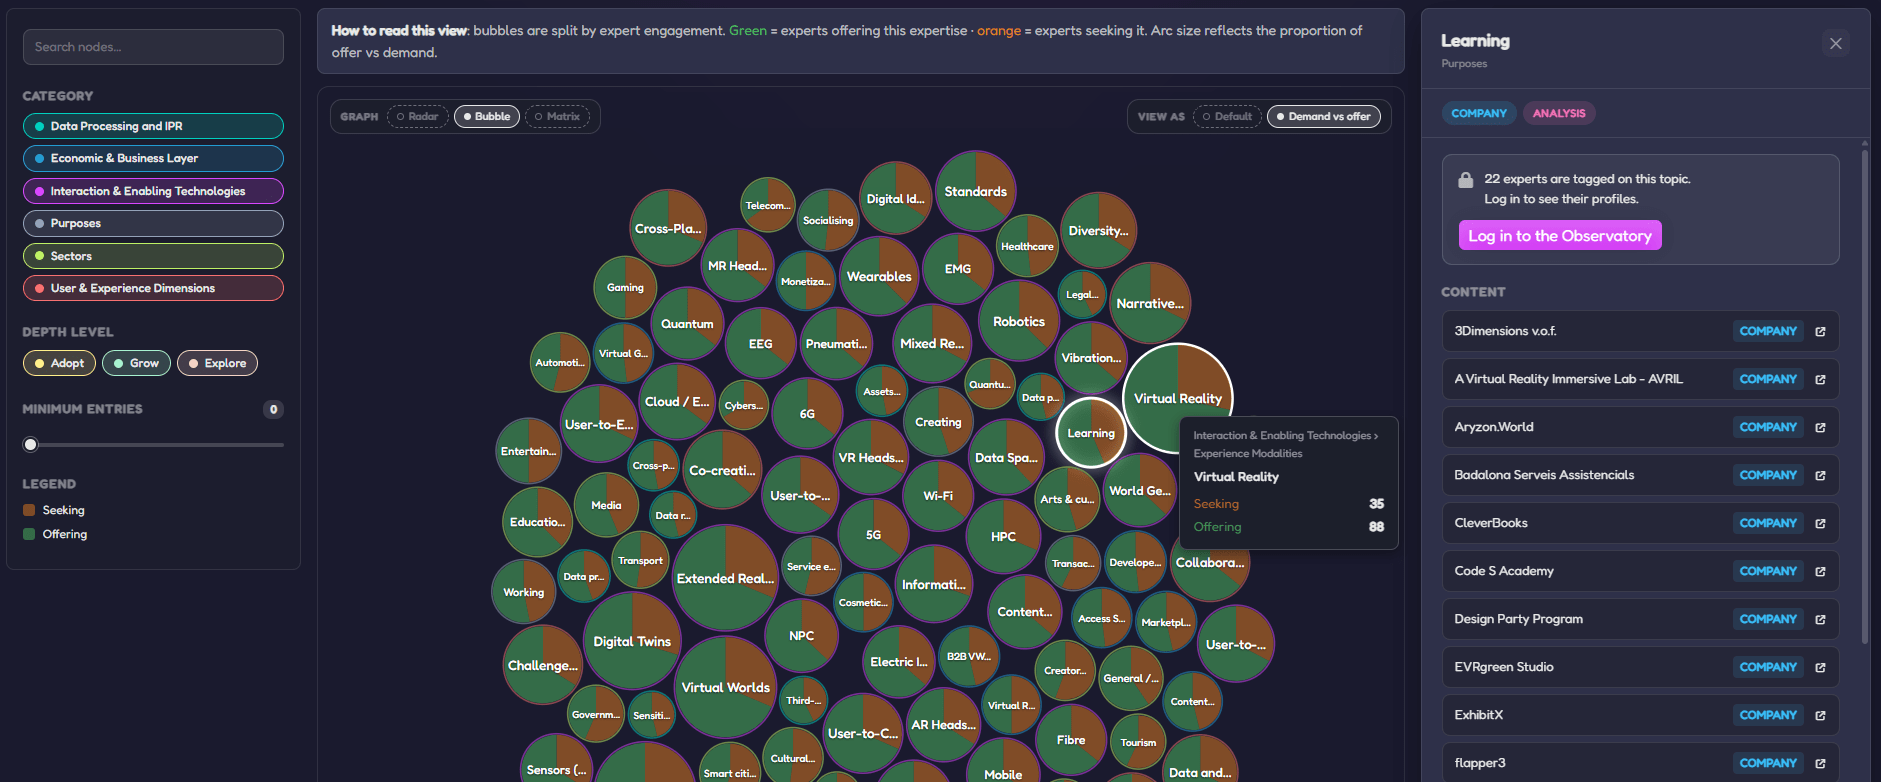 The Bubble visualisation in the OpenVerse Technology Radar has a sub-view for offer and demand of XR expert’s skills
We prototyped everything first
Before any production code was written, we built the whole interface as a working prototype: filters, tooltips, detail panel, zoom and pan, empty states, every interaction. Several questions that look trivial on a wireframe took a few rounds to settle. What should happen when someone clicks a filter that is already active alongside all the others? Where does a category label go when its slice is only 23 degrees wide? How do you stop dots from jumping to new positions every time a filter is toggled?
Answering those in a standalone prototype let us test each behaviour on real data, discard what did not work, and hand the development phase an interaction model that had already been validated.
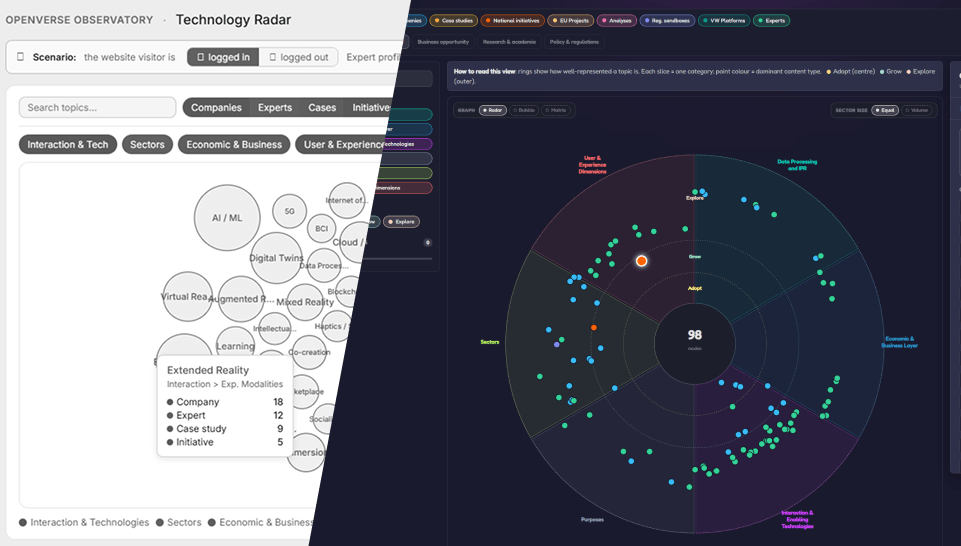 How the OpenVerse Technology Radar evolved from a prototype to its final, published version
Under the hood
Drupal at the core.
The Observatory runs on Drupal, and the Radar is a native component of that platform. Companies, experts, case studies, national initiatives, regulatory sandboxes and EU projects all live there as structured, taxonomy‑tagged content, which means the Radar always shows the current state of the database, with no periodic export step in between.
A custom module for server‑side data access.
We wrote a bespoke Drupal module that aggregates the data the Radar needs and serves it through server‑side queries. Expert profiles are the reason this matters. Anonymous visitors can see how many experts work on a given topic; names and profile links are resolved server‑side and returned only for authenticated sessions. Registration on the Observatory is free and open to anyone in the XR and Virtual Worlds community, so the information stays fully available to the people it is meant for while remaining out of reach of anonymous scrapers.
D3.js for the visualisation layer.
All three views are rendered with D3.js, which gave us the control over SVG geometry that several behaviours required: dot positions derived deterministically from each topic identifier, so filtering never reshuffles the chart; radial distribution that guarantees no two dots overlap inside the same slice; arcs sized to the true offer and demand ratio.
One palette across the platform
The Observatory also has a Taxonomy Explorer where the taxonomy can be browsed on its own. The Radar reuses the same colour coding for content types, so blue reads as Companies in both tools. Anyone who picks up the palette in one part of the platform carries it into the other.
Getting there took some care. Eight content types, six taxonomy categories and three depth levels can all appear on screen at the same time, which is eighteen colours competing for attention on a dark background. We checked them pairwise and reworked the ones that sat too close, so that a content type never reads as a taxonomy category at a glance.
Have a look
The Technology Radar is live at observatory.open-verse.eu/radar.
More than 200 XR experts from across Europe and beyond have registered on the Observatory. Each profile lists the skills that person offers and the skills they are looking for, which is exactly what the offer and demand view draws on. The matchmaking function suggests relevant connections from those signals, and members can open a conversation through private messaging.
Have a dataset that needs to become something people can actually explore? Fill in the form below and tell us about it.