Interactive map viewers and data visualisations
Scroll down

The Project challenge
The EFAS project presented COMMpla with the opportunity to consolidate its expertise in GIS applications, integrating a Django backend of a MapViewer, developed in Angular, into a Drupal 8 portal. The operational launch of the EFAS-IS Visualisation Platform took place in 2019. Since then, the platform has undergone new releases, featuring improvements to enhance the service and user journey, responding to feedback from JRC and CEMS-Flood users.
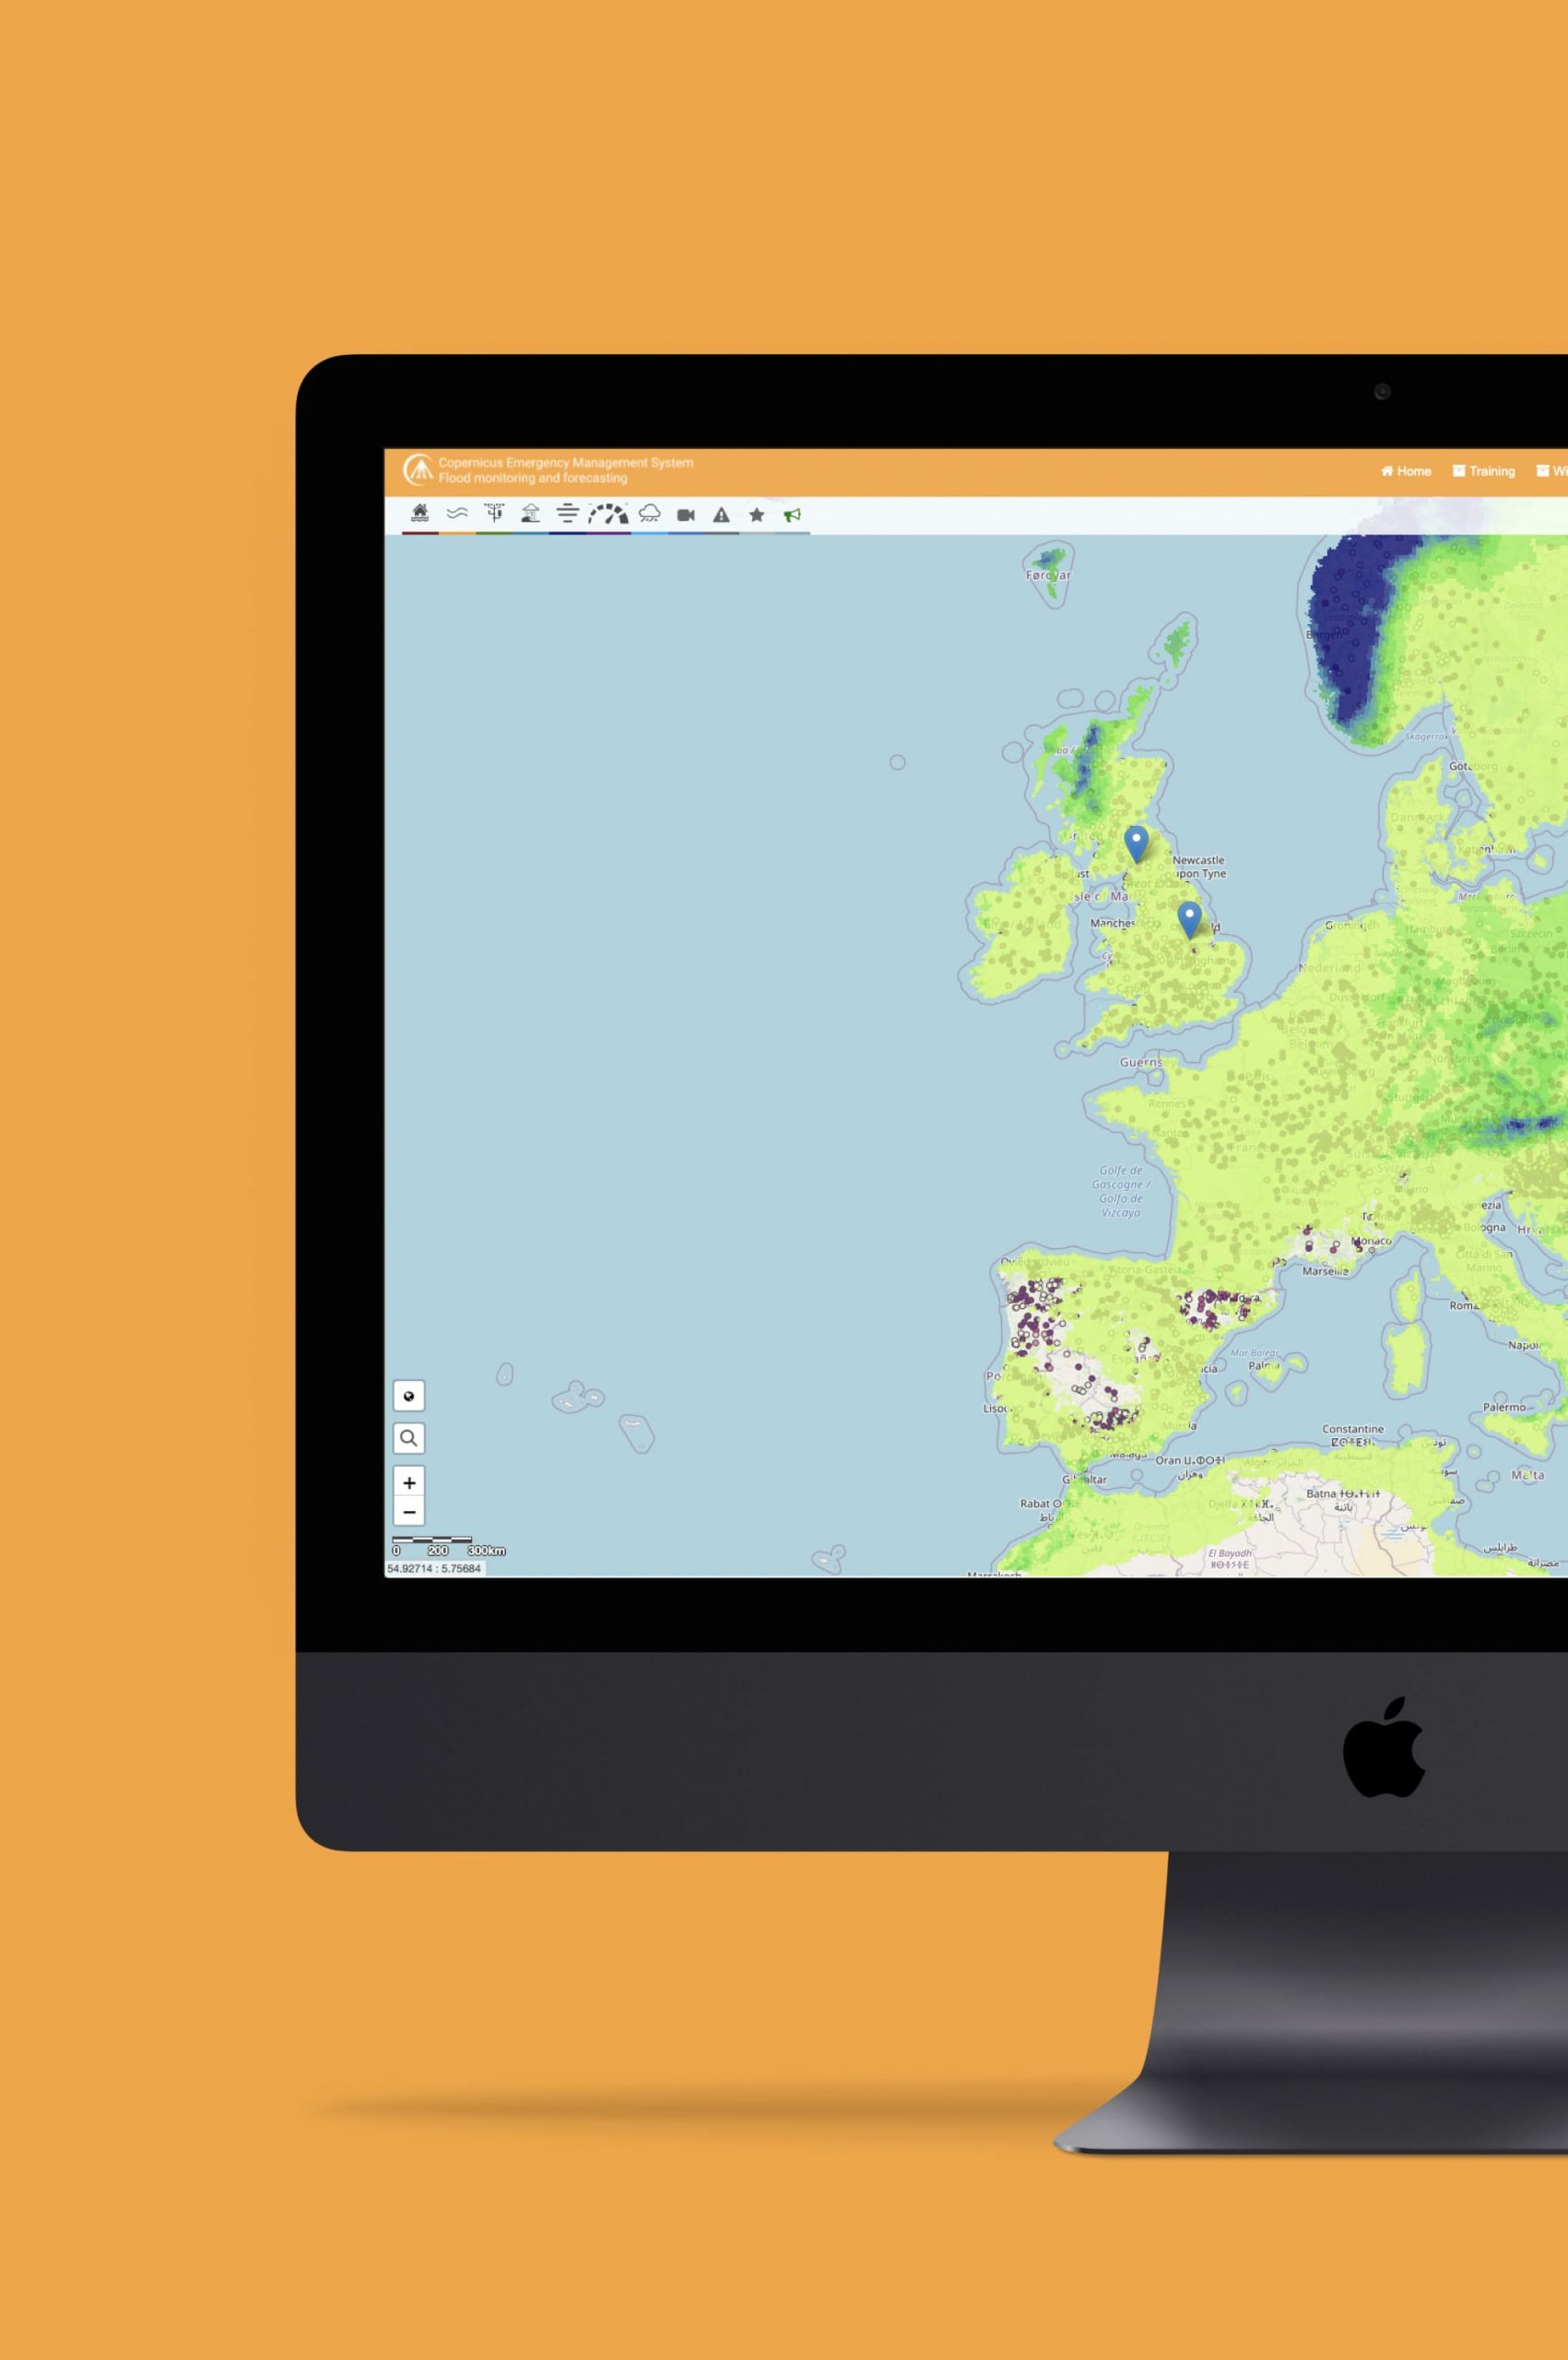
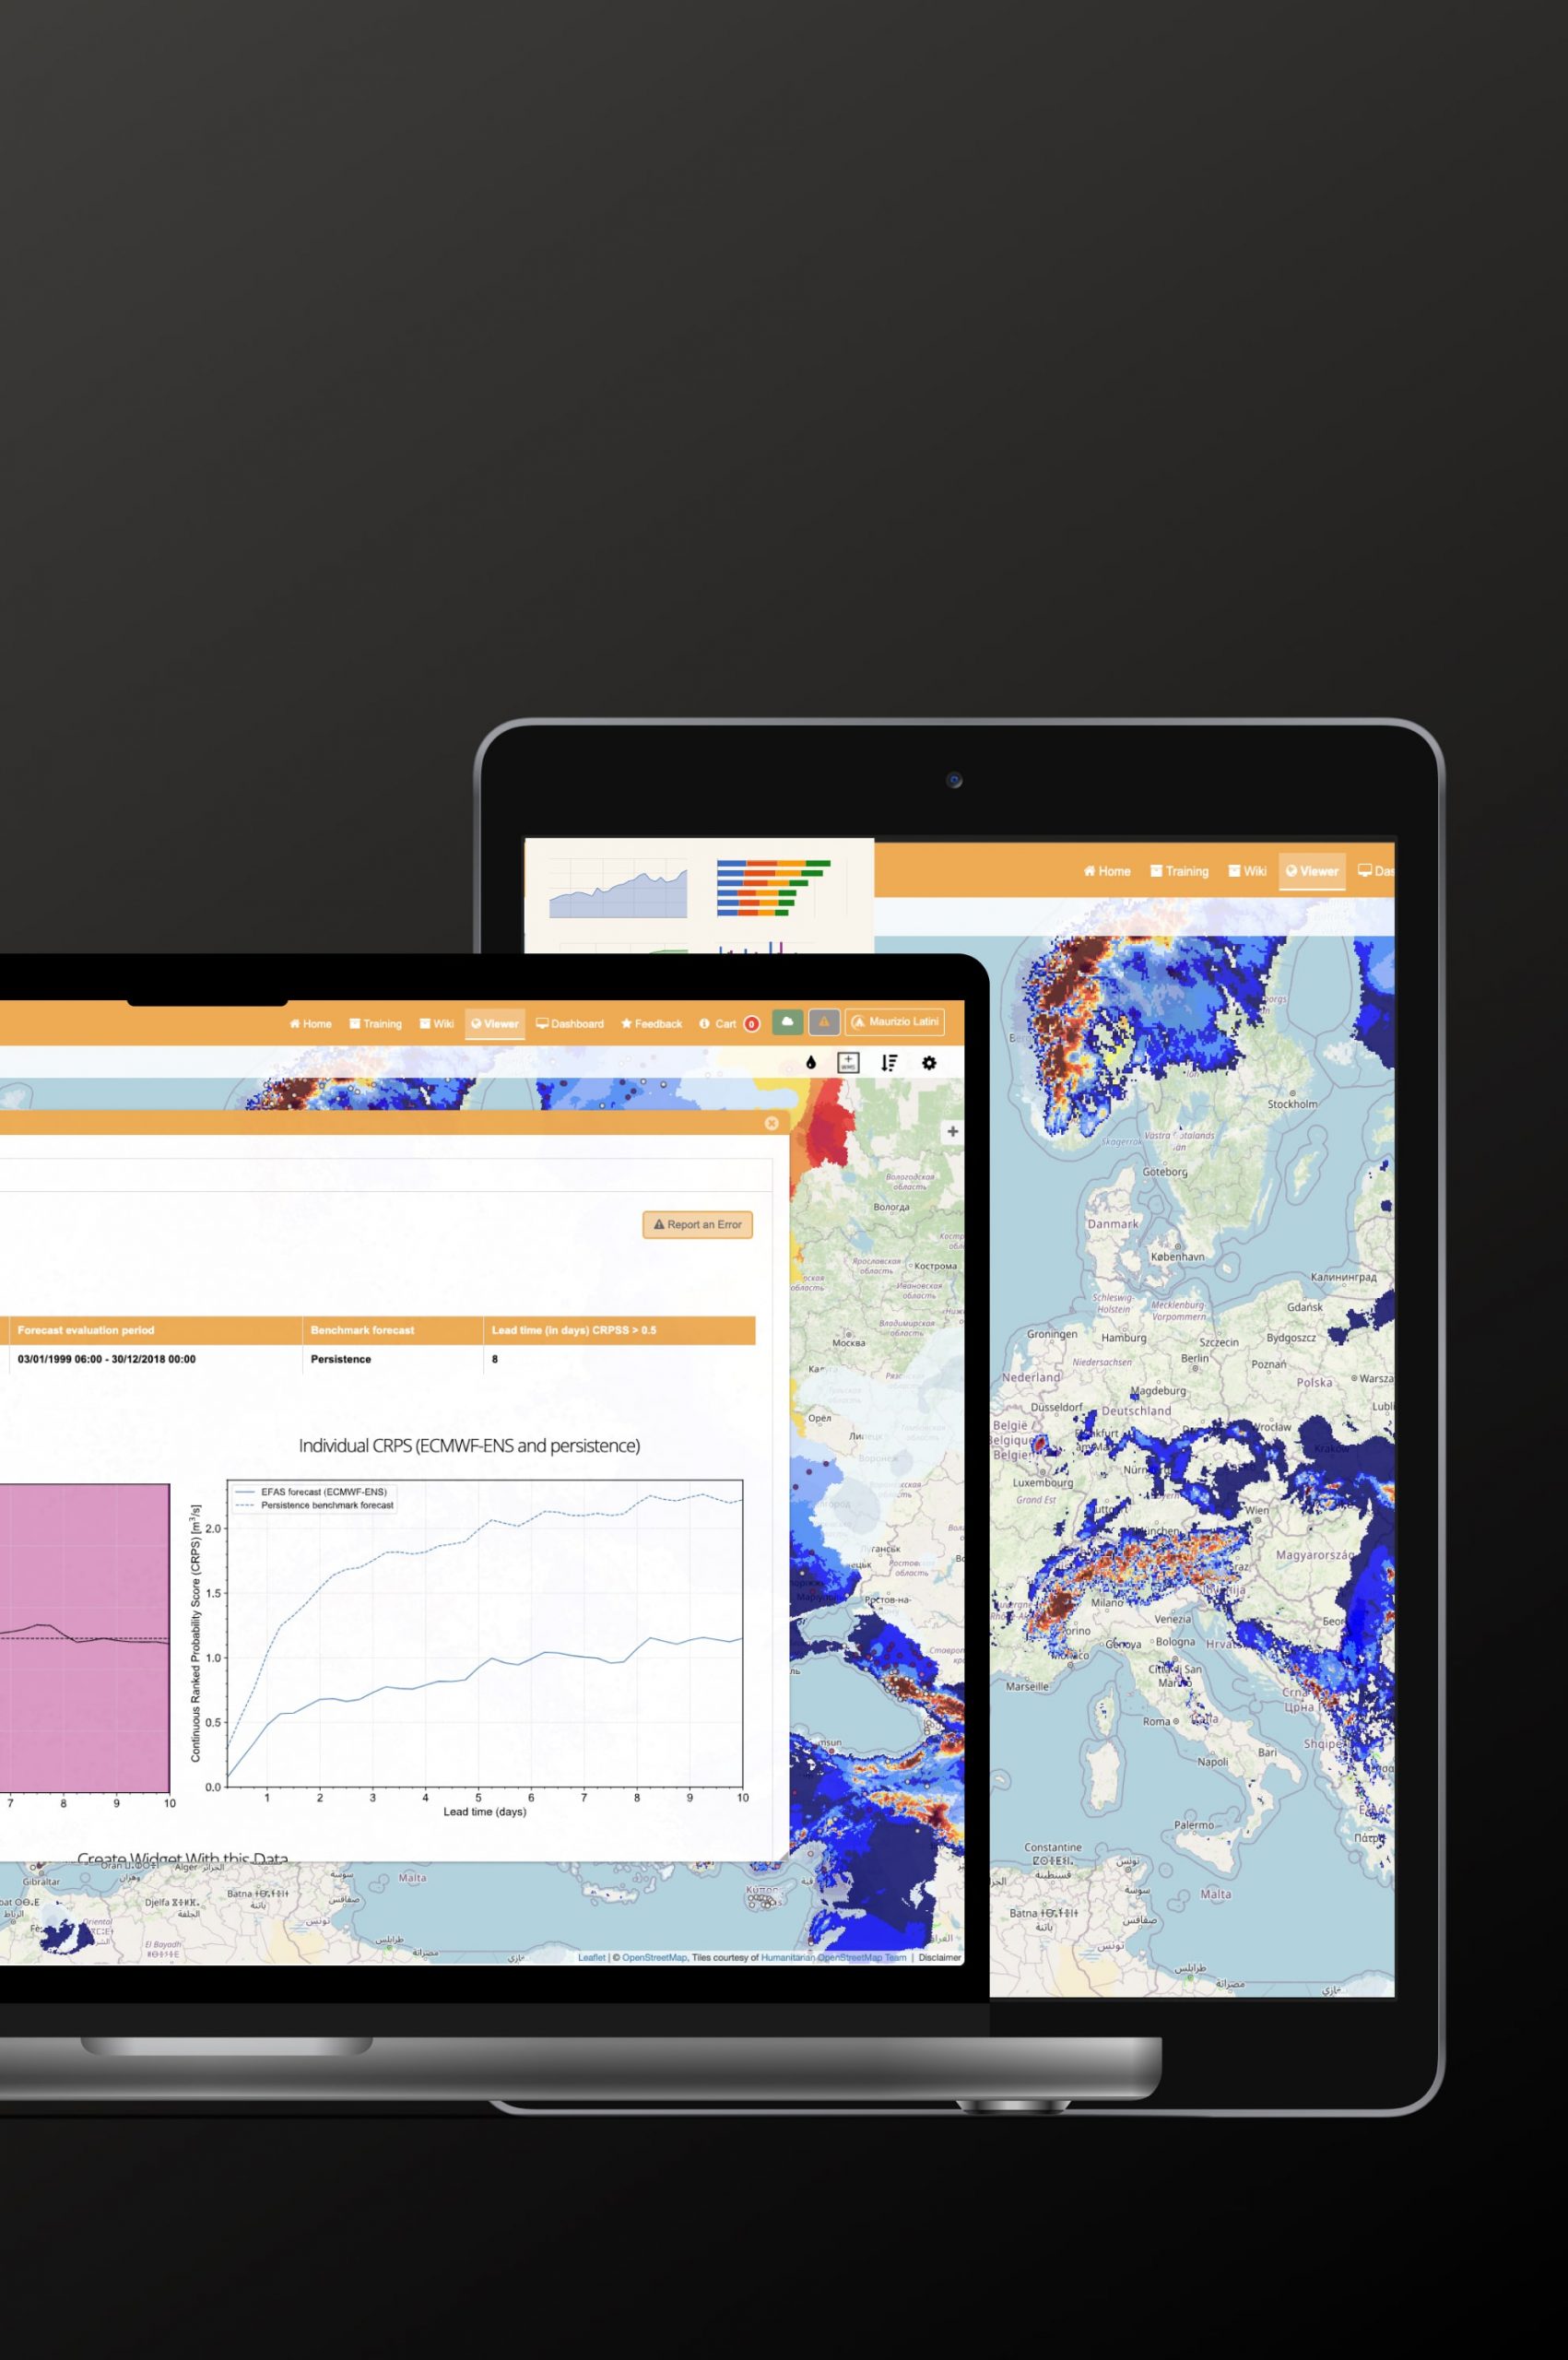
EFAS provides information on ongoing and forecasted floods in Europe. The MapViewer allows navigation, providing a set of data tools allowing users to search across multiple datasets or within a single dataset and compare different datasets, animate the map series, etc.
The MapViewer is one of the core tools used by forecasters to browse geospatial datasets, predict potential floods across Europe and send alert messages to basin authorities.
The EFAS web platform (public and reserved area) is based on open-source software and COMMpla has helped achieve the following results:
- Provide an improved user experience of the public area, offering external visitors a more immediate overview of EFAS activities, as well as a revised structure for the reserved area with a more intuitive navigation;
- Provide users with a streamlined access to EFAS datasets, both through the User Interface (UI) and through standard protocols (Data and Geographical Data Sets, THREDDS, TDS, OPeNDAP, OGC WMS WMS-T and WCS, HTTP, and other remote data access protocols);
- Retrieve spatial/temporal datasets through standard OGC services;
- Access historical databases of past forecasts and forecast performance;
- Access multimedia materials including videos, photos, charts and press releases;
- Create a custom workspace for monitoring the datasets of interest via the new dashboard;
- Browse the EFAS-IS web-platform via mobile (both the public and reserved areas are responsive).
Methodologies and technologies involved:
Angular, Drupal, Scrum, JIRA, LAMP, PHP, Django, JavaScript, Leaflet, OGC, WMS, OAuth2, Identity and Access Management (IAM) , JWT, MySQL, Keycloak, SSO, HTML5, CSS3, JSON, Linux, Kubernetes, API, CI/CD, jQuery, media queries and bootstrap.
Do you want to learn more about how we can develop your new interactive map and data visualisation interface?
Fill out the form below and let’s have a chat!